MIT estimation method condensed
This distills and annotates the portions of the MIT study (PDF) applicable to how the study computed heating and cooling load attributable to doors, section 10.1, “air leakage estimation,” in particular.
Original text is in regular font. Italics indicate expository additions.
This calculation uses door-usage data obtained from the experiments on building E25, Whitaker College, which has an average of 837 passaged per hour, so we can infer that all calculations apply to building E25 only.
Some results can be obtained analytically with formulae, but others can only be interpolated based on charts.
Air leakage through revolving doors
It is valid to calculate the total air leakage due to revolving door usage by simply summing the leakage past door seals and cracks and the the displaced air due to the revolving of the door.
Revolving door seal leakage
Infiltration though seals without visible cracks and through door seals with visible cracks can be estimated by using figure B1 and B2, but B2 seems mislabelled, as it only makes sense to use it for infiltration through swinging door seals, later. Revolving door seal leakage can be read directly from B1. Total revolving door leakage can be assumed the sum of leakage from all doors, that is, the two in building E25, seen on figure A1.
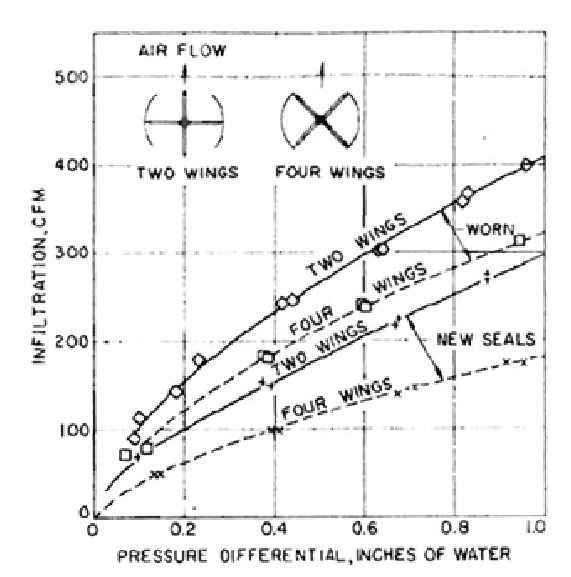
Figure B1: infiltration through new and worn door seals (door not revolving)
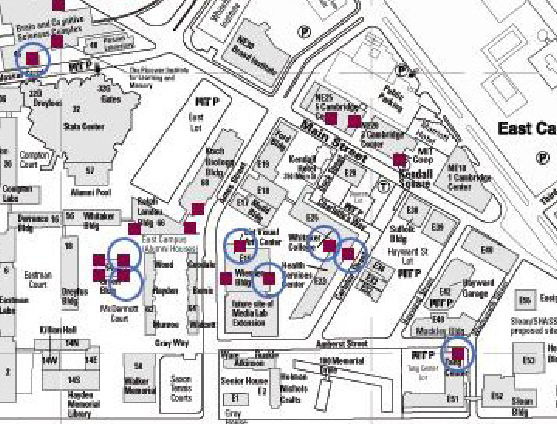
Figure A1: map of MIT campus with building numbers. Revolving doors on campus are represented by the magenta blocks. The blue circles represent the revolving doors examined in the study.
Revolving door motion leakage
If the number of users is higher than 250 passages per hour, air leakage due to the revolving of the door can be directly obtained from figure B3. Otherwise, the door’s average revolving speed and operating time fraction need to be estimated first, using figure B4. Then, with the estimated averaged revolving speed, the infiltration can be obtained from figure B5.
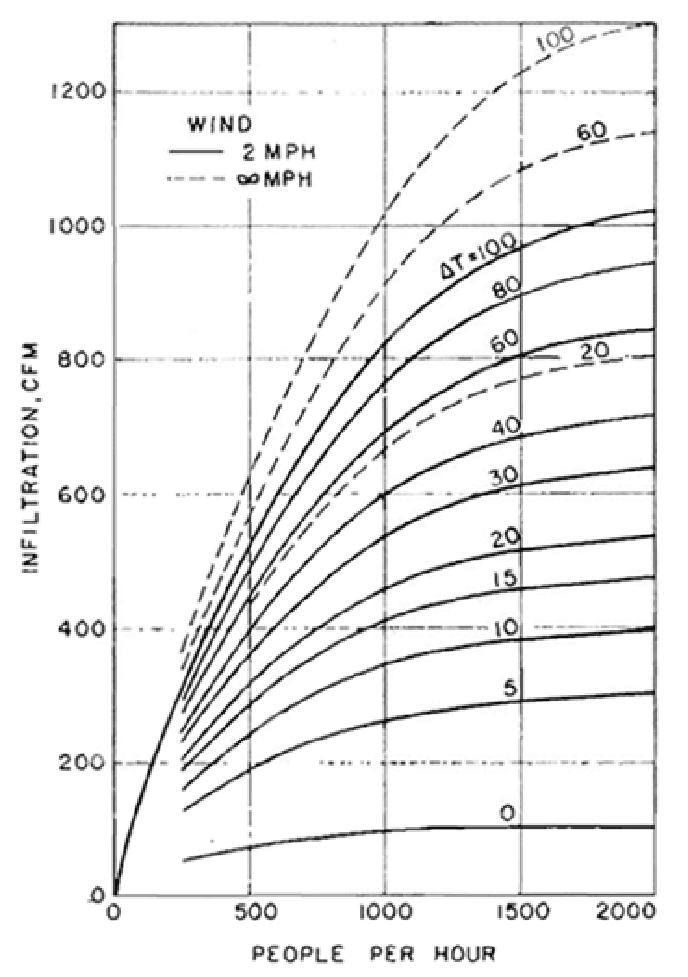
Figure B3: infiltration through manually operated revolving door (air movement 35 fpm indoors, air leakages past door seals deducted)
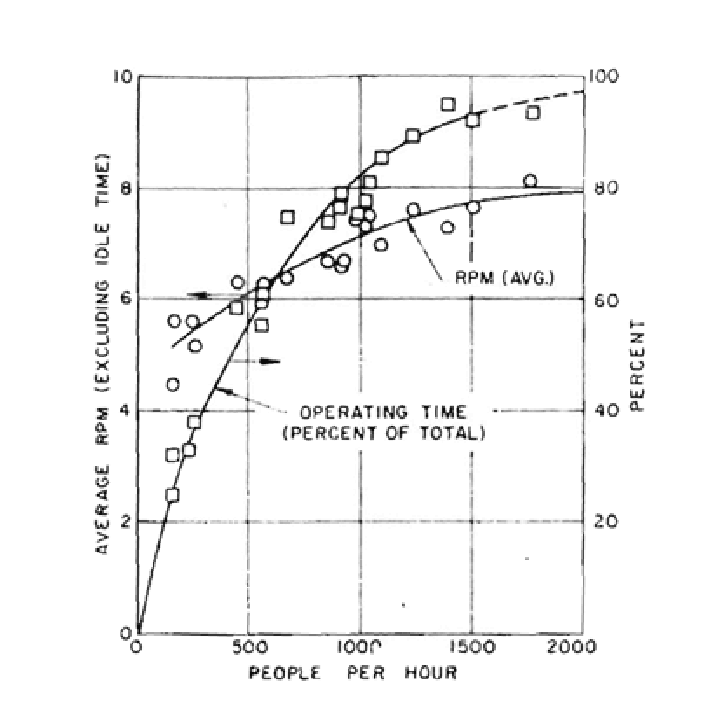
Figure B4: Operating time and averaged rpm vs. traffic rate of manually operated revolving door

Figure B5: infiltration vs. rpm and indoor-outdoor air temperature difference (air leakages past door seals deducted)
Air leakage through swing doors
Total air leakage through a swing door is a combination of the infiltration due to the swinging of the door and the leakage past the door’s cracks.
Swinging door seal leakage
The swing doors at building E25 have no visible cracks, to make current calculations conservative and applicable as the weather stripping deteriorates, these calculations assume total visible cracks 10 inches long and 0.5 inches wide, presumably a sum for all swinging doors in E25, not per door. Figure B2 gives infiltration through swinging door seals:
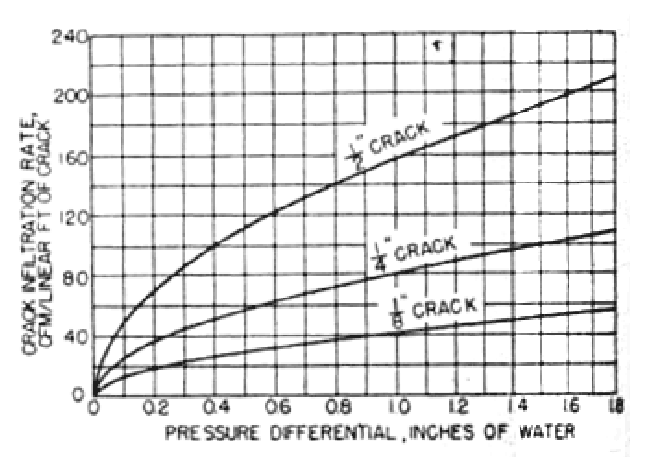
Figure B2: infiltration through door cracks (door not revolving, probably a typo)
Swinging door motion leakage
Air infiltration due to swing door usage depends on the indoor-outdoor pressure differential and the entrance coefficient. The entrance coefficient can be obtained from figures B6 and B7, but since B7 applies to vestibule entrances, it appears inapplicable to building E25. Furthermore, since nothing in the information given for revolving doors indicates a correction for human obstruction, assume swinging door calculations are also uncorrected. Once the entrance coefficient is known, the infiltration due to the swinging of the door can be estimated using figure B8.
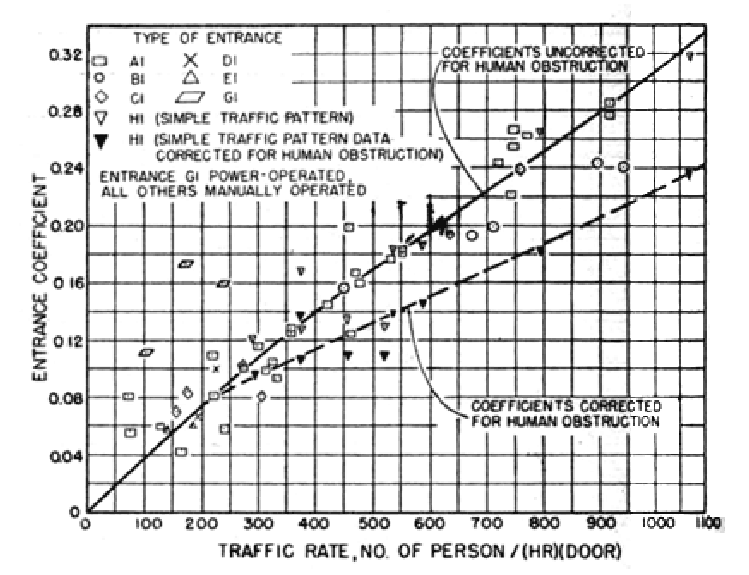
Figure B6: Entrance coefficients for single-bank entrances
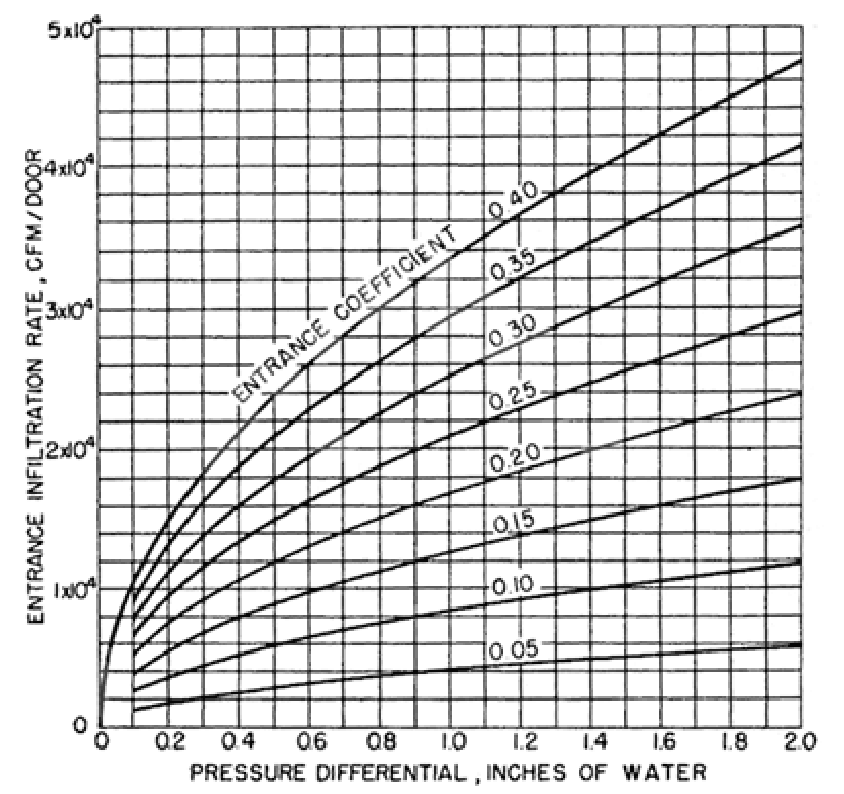
Figure B8: (Swing door) entrance infiltration for various pressure differentials and traffic rates, or, rather, entrance coefficient, derived from people per hour
Pressure differential
Seal leakage, for both revolving and swinging doors depends on the difference between indoor and outdoor air pressure. Infiltration from swinging door motion also depends on pressure differential, but infiltration from revolving door motion does not. The total pressure differential is coupled by two components: stack pressure difference and wind pressure.
Stack difference is a function of indoor and outdoor air temperature and densities, the height of the building and the height of the door. We can assume the door is 7 feet tall, and estimate height of E25 as 70 feet from this picture:

Equation C1 shows how to calculate the total pressure differential. Equation C2 shows how to calculate the stack pressure difference. Equaction C3 and figures B9 and B10 can be used to calculate the wind pressure. Only one of figures B9 and B10 should be necessary, but the paper does not indicate which part of the figures to read for wind surface pressure coefficients.
- C1: Total pressure (inches of water)
`Deltap = p_(w) - Deltap_(s)`- C2: Stack pressure (inches of water)
`C_1 rho_0 ((T_o - T_i) / T_i) g (H_"NPL" - H)``C_1 = 0.00598`Unit conversion factor,
`(\"inches of water") * "ft" * "s"^2 / "lb"``rho_o = 0.075`Outdoor air density,
`"lb" / "ft"^3`. In the original, captions for equation C3 indicate a value, but not here. Assume they should be the same.`T_o`Outdoor temperature, degrees Rankine. Average temperature by month from table D1.
`T_i = 532`Indoor temperature, degrees Rankine.
`g = 32.2`Gravitational acceleration,
`"ft"/"s"^2``H_"NPL" = 35`Height of neutral pressure level,
`"ft"`, may use half the height of the building`H = 3.5`Height of the point of interest,
`"ft"`, may use half the height of the door
- C3: Wind pressure (inches of water)
`p_w = C_2 C_p rho U^2 / 2``C_2 = 0.0129`Unit conversion factor,
`("inches of water") * "ft"^3 / ("lb" * "mph"^2)``C_p`Wind surface pressure coefficient (see Figures B9 and B10), but no indication of which value to use. If using figure B9, notice that the caption indicates the values should be divided by 100.
`rho = 0.075`Outdoor air density,
`"lb"/"ft"^3``U`Wind speed,
`"mph"`. The average wind speed for the month, from table D1. No correction indicated for wind pressure being proportional to the square of wind speed.

Figure B9: Local pressure coefficients (`C_p * 100`) for tall buildings with varying wind
direction.
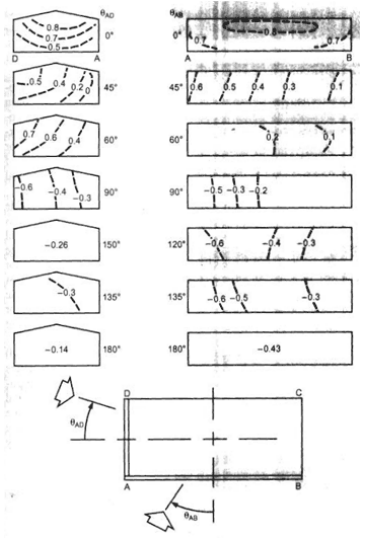
Figure B10: Local pressure coefficients for low-rise buildings with varying wind direction.
Month |
Avg. High Temperature (F) |
Avg. Wind Speed (mph) |
|---|---|---|
Jan |
43 |
12 |
Feb |
38 |
13 |
Mar |
47 |
12 |
Apr |
58 |
11 |
May |
58 |
11 |
Jun |
77 |
10 |
Jul |
81 |
10 |
Aug |
82 |
9 |
Sep |
76 |
10 |
Oct |
61 |
13 |
Nov |
54 |
11 |
Dec |
38 |
12 |
Energy consumption
The displaced heat, or thermal energy, must be offset by the building’s heating or air-conditioning equipment, assumed to be 60% efficient. Using the air leakage rate obtained from the previous calculation, equation B4 [typo, actually C4] shows how to calculate the total heat flow.
- C4: Heat transferred (Joules)
`E_(ht) = (T_i - T_o) rho V C``T_i = 22.2`Indoor air temperature, degrees Celcius
`T_o`Indoor [typo, actually outdoor] air temperature, degrees Celcius
`rho = 1.2929`Air density,
`"kg"/"m"^3`, presumably outdoors. When converted to pounds per cubic foot, this is slightly higher than the 0.075 indicated for calculating pressure differential, but not by much.`V`Volume of air,
`"m"^3`, computed as described`C = 1.03 * 10^3`Heat capacity,
`"J"/("kg" * "K")`